


Prediction markets have a unique draw: the ability to bet on real-world events, from the weather to election results to whether the Federal Reserve will raise interest rates, all from the convenience of a smartphone. To many, they look like a way to turn knowledge or a hunch into some extra cash, but that rarely works out.
More than 82% of Polymarket wallets, which stand in for bettors on the prediction market, lost money on wagers that resolved, or reached a final yes-or-no answer, in 2025, according to a 2026 Motley Fool analysis of about 313,000 wallets across 210 high-volume markets in seven categories. The typical loss was small, but the winnings were concentrated: The top 1% of winning wallets captured about 85% of all profits.
The S&P 500, by comparison, has returned 9.98% per year since 1928, including dividends but before inflation, according to Motley Fool research on the average stock market return.
The gap comes from how each market works. Stock returns come from company profits, while a prediction market payout comes from another trader's loss. For every winner in a prediction market, someone else has to lose, and platform fees take a further cut.
Key points
- Over 82% of Polymarket wallets incurred losses in 2025, with a median wallet loss of $0.16.
- The top 1% of profitable wallets on Polymarket captured about 85% of all gains from betting.
- In contrast, the S&P 500 offers compounding returns, growing a $1,000 investment to $6,703 over 20 years.
More than 82% of Polymarket wallets lost money
Roughly 17% of wallets made a profit, while more than 82% lost money overall, according to the analysis, which aggregated results from about 313,000 wallets across every market where each wallet traded.
The loss rate fell as wager size grew, the analysis found: 84% of wallets that spent at least $10 on contracts finished with a net loss, compared with 73% of those that spent at least $1,000. Most losses were small: The median wallet (the middle result, with half of wallets doing better and half worse) lost 16 cents, and about 95% of wallets finished within $100 of breaking even in either direction, according to the analysis.
Pew Research Center found a similar pattern over a shorter window. Among 11,989 Polymarket accounts tracked from May 7 to June 19, 2026, the average trader spent a little over $600 and ended with a net loss of less than $2.
What the Motley Fool analysis found
Results across 210 Polymarket markets that resolved in 2025, with each wallet's results added across markets.

The Motley Fool
Published estimates of how many Polymarket wallets lose money run from 69% to 84%, according to CEPR research and an independent analysis reported by The Defiant, and they cover different periods and different sets of wallets.
How other prediction market research compares
Studies of Polymarket wallets, by sample and finding.

The Motley Fool
The top 1% of winning wallets captured about 85% of all profits
The Motley Fool's analysis of prediction market outcomes on Polymarket found that gains are highly concentrated: The top 1% of profitable wallets won about 85% of all profits, and the top 5% captured more than 96% of all profits. CEPR research on Polymarket found the same pattern across 588 million trades: The top 1% of users with positive profits captured 76.5% of all profits.
Sports were the most extreme case of winning concentration. Among Polymarket wallets that bet on sports, 94% finished with a net loss, yet sports wallets as a group finished roughly even, meaning a small group collected almost all the winnings. The top 1% of winning sports wallets captured 94% of sports profits, and outside sports, 69% of wallets lost money, according to the Motley Fool analysis.
Stock market gains are also concentrated, but not in the same way. The wealthiest 1% of Americans own about half of all U.S. stock value, according to Federal Reserve data compiled by the Motley Fool, so they capture roughly half of the dollar gains when the market rises. Every investor in the same S&P 500 index fund earns the same percentage return, regardless of how much they have invested.
Stock returns come from company profits; prediction market payouts just move money between traders
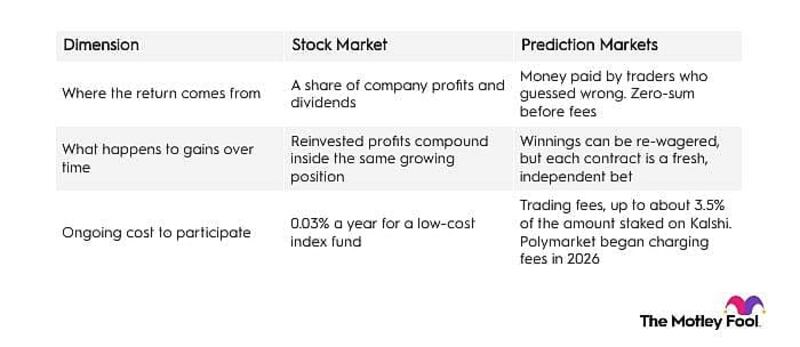
A share of a stock represents an ownership stake in a company, which entitles the holder to a slice of its profits and dividends. A prediction market contract pays $1 or $0 depending on whether an event happens, and the winners' payout comes from the losers' wager. Before fees, one trader's gain is exactly another's loss, a condition known as a zero-sum market.
Fees turn that zero-sum structure into a negative-sum one, where traders as a group lose more than they win. Kalshi, another prediction market, charges up to 3.5% of the amount staked on contracts priced near 50 cents, or about $35 on $1,000, according to its fee schedule, and Polymarket began charging similar price-based fees in certain categories in 2026, according to its fee documentation. The Motley Fool analysis covers 2025, before Polymarket's fees began, and most wallets still lost money. A low-cost S&P 500 index fund, by comparison, charges 0.03% a year, or about 30 cents per $1,000, according to Vanguard.
On Kalshi, the average contract lost between about 10% and 32%, or 10 to 32 cents per dollar wagered, depending on whether the trader posted a price or accepted one, according to CEPR research.
Sports betting uses a similar structure, with sportsbooks taking a cut of every wager. Sportsbooks kept about 9.74% of every dollar wagered in 2025, or about $9.74 per $100, according to data analyzed by the Motley Fool. Polymarket's 2025 sports markets carried no trading fees, and the sports wallets in the Motley Fool analysis finished roughly even as a group.
How the stock market pays out versus prediction markets
Where returns come from, what happens to gains over time, and the cost of participating.
The Motley Fool
Why compounding stock market returns beat prediction market wagers
Compounding, in which reinvested profits earn returns of their own, can turn a modest stock market return into significant wealth over time, but no equivalent exists in prediction markets.
A $1,000 investment in the S&P 500 growing at 9.98% a year — its compound annual growth rate since 1928 (the average annualized growth rate) — would reach $1,100 after one year, $2,589 after 10 years, and $6,703 after 20 years. The S&P 500 does not deliver that rate every year: It had positive returns in 72 of the 98 years from 1928 through 2025, according to Motley Fool research.
In contrast, bets made on prediction markets settle independently when each event resolves, and winnings can be re-wagered only as new, separate bets. Applying the Kalshi average contract loss of about 10% to 32% to a single $1,000 contract would leave between about $680 and $900 once the bet resolves, though a single contract may settle in days, so the time frames on returns from a long-term stock market investment and prediction markets are not equal.
Those averages are pulled down by low-priced, long-odds contracts, which win far less often than their prices imply, while high-priced contracts win more often and earn small positive returns, according to CEPR research.
Growth of a $1,000 stake: Stock market versus prediction market
Ending value of $1,000 under each scenario. The table is an illustration built from historical averages. It is not a forecast or a real product return.

The Motley Fool
Why investors should be aware of the differences between the stock market and prediction markets
Prediction markets can feel like an exciting way to quickly make money by betting on events that a user may be knowledgeable about. For many who feel financially behind, the breadth of events to wager on and the chance to win in a high-stakes gamble can be big draws, especially compared to the perceived slow, boring waiting game of stock market investing.
But speed, excitement, and the prospect of a big payout from a risky gamble cover up structural weaknesses in prediction markets and shouldn’t motivate financial decision-making.
The Motley Fool analysis shows that most wallets end up in the red, with very few posting significant returns. The S&P 500, on the other hand, has returned nearly 10% per year over the long run, before inflation, with some losing years, regardless of the amount invested.
Methodology
The Motley Fool pulled Polymarket position data for 210 markets across seven categories (politics, economics, crypto, sports, geopolitics, pop culture, and science and tech) that resolved between Jan. 1 and Dec. 31, 2025. The sample took up to 30 markets per category, in order of trading volume, and no more than three markets from any one event. For each market, open and closed positions were collected, and each wallet's results were added across all sampled markets. A wallet counts as a loser if its combined profit and loss is below zero.
Positions held by Polymarket's smart contracts and positions with no recorded purchase cost were excluded, as were unclaimed positions with exactly $0 in profit or loss. One trader can use several wallets, so wallets do not map exactly to people. Profit and loss across the sampled markets did not net to exactly zero, differing by about 1% of market volume, so the analysis reports shares of wallets and profit concentration rather than returns per dollar wagered. The results describe this sample, not all Polymarket activity. The Kalshi figures in this article come from CEPR research, and the Motley Fool analysis covers Polymarket only.
This story was produced by The Motley Fool and reviewed and distributed by Stacker.